AMD's RX 7800 XT features 16GB memory and 64MB cache. The RTX 4070 offers 12GB of VRAM and 36MB of L2 cache.
Areej Syed
AMD’s Radeon RX 7800 XT is its most popular RDNA 3 graphics card. Powered by the Navi 32 core, it delivers performance comparable to the GeForce RTX 4070. Following the latest price revision, it retails at $489, while the 4070 starts at $519. We’ll test these graphics cards across 33 gaming benchmarks, including 1080p, 1440p, and ray-tracing to decide the winner.
NVIDIA GeForce RTX 4070 vs RTX 4070 Super: Specs Comparison
NVIDIA RTX 4070
AMD RX 7800 XT
GPU
AD104
Navi 32
SMs
46
60
Shaders
5,888
3,840
VRAM
12GB
16GB
L2 Cache
36MB
64MB
Memory bus
192-bit
256-bit
Memory Clock
21Gbps
19.5Gbps
GPU Boost Clock
2,475MHz
2,435MHz
TBP
200W
263W
Price
$519
$489
The Radeon RX 7800 XT is the better GPU on paper. It features a 16GB (+50%) memory buffer, a 256-bit bus, and a 64MB LLC (Last Level Cache). Meanwhile, the RTX 4070 offers 12GB of graphics memory, a 192-bit bus, and just 36MB of L2 cache. NVIDIA and AMD use different ALU (core) architectures so comparing those isn’t feasible.
NVIDIA RTX 4070 vs AMD RX 7800 XT: 1080p Performance
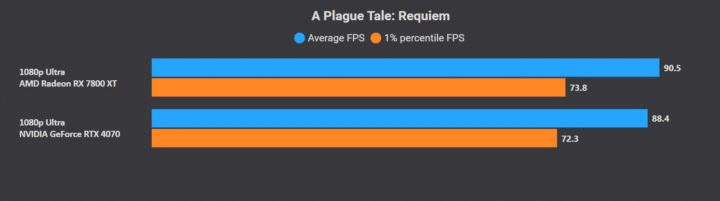
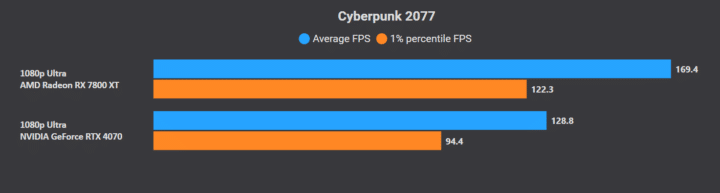
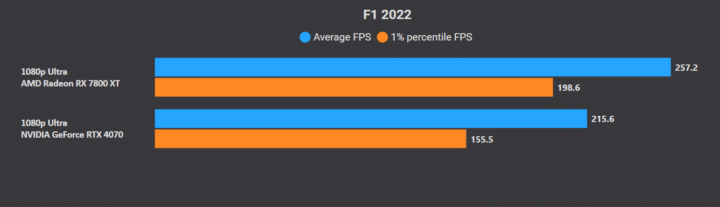
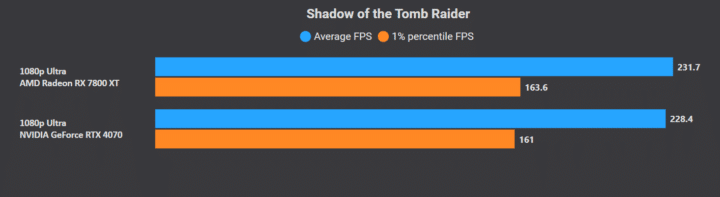
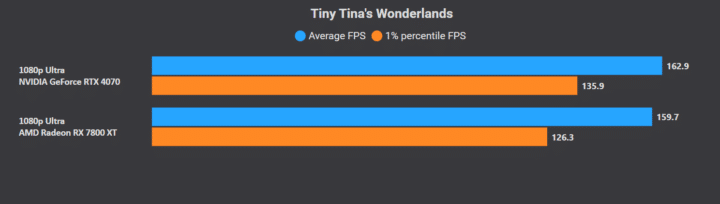
At 1080p, the AMD Radeon RX 7800 XT is +7.4% faster than the RTX 4070 on average. Most titles perform within the margin of error on the two GPUs, but a few (Cyberpunk 2077, F1 2022, and Hogwarts Legacy) favor the 7800 XT, tipping the scales in favor of Team Red.
1080p Performance
RTX 4070
RX 7800 XT
Average Framerate
161.5 FPS
173.4 FPS (+7.4%)
Max Average Power
195W
252W
FPS/W
0.82 FPS/W
0.69 FPS/W
FPS/$
0.31 FPS/$
0.35 FPS/$
The GeForce RTX 4070 has an average power consumption of 195W. The Radeon RX 7800 XT has a much higher power draw of 252W, leading to lower performance-per-watt. The value-for-money aspect is slightly better on the 7800 XT, averaging 0.35 FPS/$ (versus 0.31 FPS/$ on the 4070). Below, you’ll find the performance figures for individual games, including the average and 1% lows.
A Plague Tale: Requiem
GPU
RTX 4070
RX 7800 XT
Average Framerate
88.4 FPS
90.5 FPS
1% Lows
72.3 FPS
73.8 FPS
Assassin’s Creed Valhalla
Average Framerate
154.2 FPS
151 FPS
1% Lows
110.1 FPS
107.3 FPS
Cyberpunk 2077
Average Framerate
128.8 FPS
169.4 FPS
1% Lows
94.4 FPS
122.3 FPS
Dying Light 2
GPU
RTX 4070
RX 7800 XT
Average Framerate
167.9 FPS
162.9 FPS
1% Lows
129.2 FPS
111 FPS
F1 2022
Average Framerate
215.6 FPS
257.2 FPS
1% Lows
155.5 FPS
198.6 FPS
Ghostwire: Tokyo
Average Framerate
185.4 FPS
215.2 FPS
1% Lows
90.6 FPS
99.6 FPS
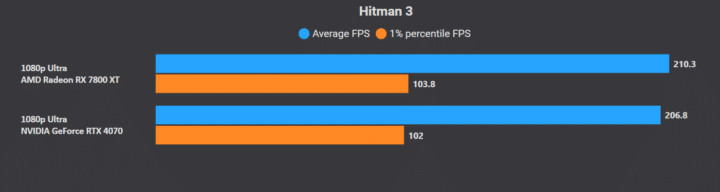
Hitman 3
RTX 4070
RX 7800 XT
Average Framerate
206.8 FPS
210.3 FPS
1% Lows
102 FPS
103.8 FPS
Hogwarts Legacy
Average Framerate
118.5 FPS
144.6 FPS
1% Lows
82 FPS
100.9 FPS
Shadow of the Tomb Raider
Average Framerate
228.4 FPS
231.7 FPS
1% Lows
161 FPS
163.6 FPS
The Callisto Protocol
RTX 4070
RX 7800 XT
Average Framerate
119.2 FPS
115.4 FPS
1% Lows
50.9 FPS
40.1 FPS
Tiny Tina’s Wonderlands
Average Framerate
162.9 FPS
159.7 FPS
1% Lows
135.9 FPS
126.3 FPS
QHD benchmarks on the next page…
NVIDIA RTX 4070 vs AMD RX 7800 XT: 1440p Performance
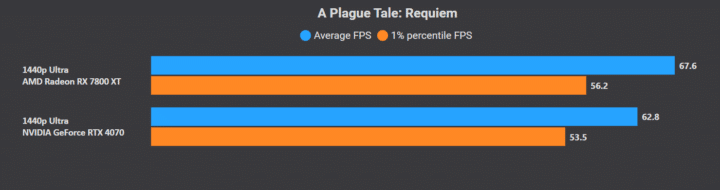
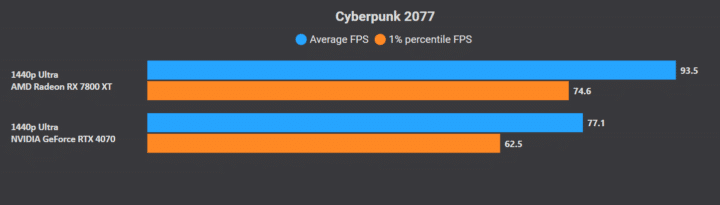
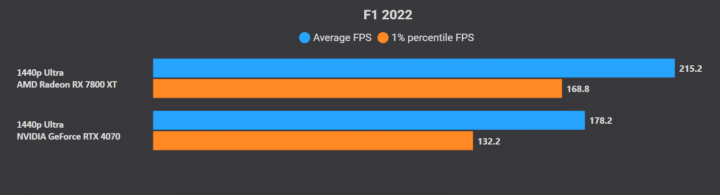
The performance delta between the GeForce RTX 4070 and the Radeon RX 7800 XT is smaller at 1440p or QHD. The AMD RX 7800 XT is 6% faster than the 4070 on average across 11 games. Like 1080p, most games deliver similar frame rates on the two GPUs. However, outliers like Cyberpunk 2077 and F1 2022 see a deficit of over 20%, tipping the scales in favor of the 7800 XT.
1440p Performance
RTX 4070
RX 7800 XT
Average Framerate
120.8 FPS
128.3 FPS (+6%)
Average Power
198W
252W
FPS/W
0.62 FPS/W
0.51 FPS/W
FPS/$
0.23 FPS/$
0.26 FPS/$
The GeForce RTX 4070 maintains superior power efficiency, while the Radeon offers a better price-performance ratio. Below, you’ll find the individual performance numbers of the two graphics cards in different titles.
A Plague Tale: Requiem
GPU
RTX 4070
RX 7800 XT
Average Framerate
62.8 FPS
67.6 FPS
1% Lows
53.5 FPS
56.2 FPS
Assassin’s Creed Valhalla
Average Framerate
117.4 FPS
119.2 FPS
1% Lows
87.6 FPS
83.9 FPS
Cyberpunk 2077
Average Framerate
77.1 FPS
93.5 FPS
1% Lows
62.5 FPS
74.6 FPS
Dying Light 2
GPU
RTX 4070
RX 7800 XT
Average Framerate
112.9 FPS
119.5 FPS
1% Lows
91.8 FPS
99.8 FPS
F1 2022
Average Framerate
178.2 FPS
215.2 FPS
1% Lows
132.2 FPS
168.8 FPS
Ghostwire: Tokyo
RTX 4070
RX 7800 XT
Average Framerate
144.4 FPS
147.2 FPS
1% Lows
84.8 FPS
88.5 FPS
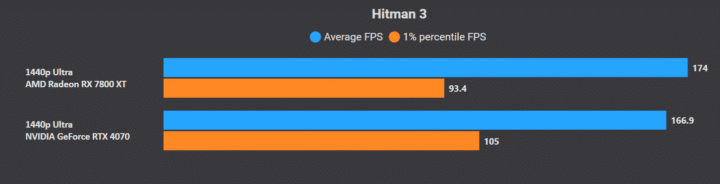
Hitman 3
Average Framerate
166.9 FPS
174 FPS
1% Lows
105 FPS
93.4 FPS
Hogwarts Legacy
Average Framerate
94.1 FPS
108.6 FPS
1% Lows
67.1 FPS
79.8 FPS
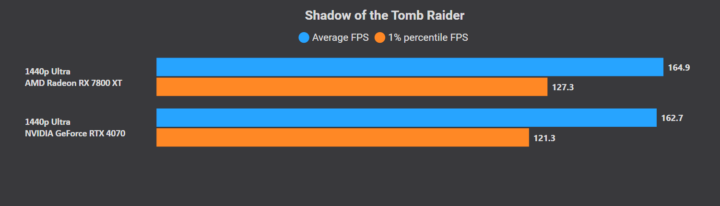
Shadow of the Tomb Raider
GPU
NVIDIA RTX 4070
RX 7800 XT
Average Framerate
162.7 FPS
164.9 FPS
1% Lows
121.3 FPS
127.3 FPS
The Callisto Protocol
Average Framerate
100.7 FPS
88.1 FPS
1% Lows
39.4 FPS
29.1 FPS
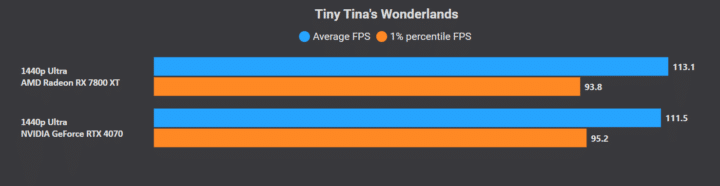
Tiny Tina’s Wonderlands
Average Framerate
111.5 FPS
113.1 FPS
1% Lows
95.2 FPS
93.8 FPS
Ray Tracing Benchmarks on the next page…
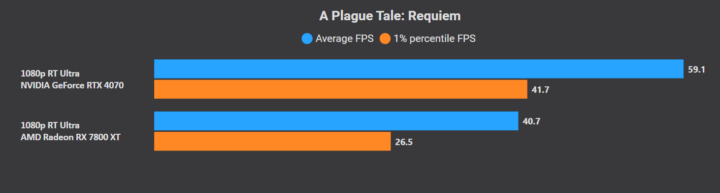
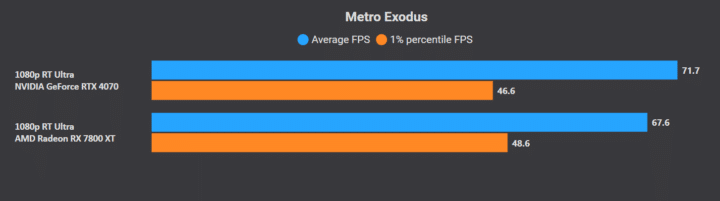
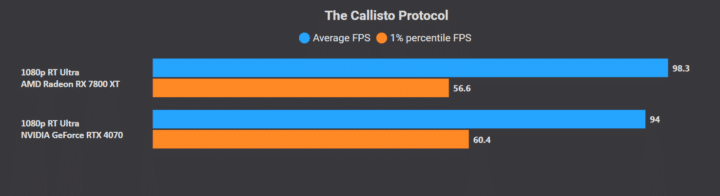
NVIDIA RTX 4070 vs AMD RX 7800 XT: Ray Tracing Performance
The RTX 4070 offers superior performance in ray-traced games, with an average lead of 11.9% over the RX 7800 XT. The budget Lovelace card wins in 9 out of 11 titles while drawing considerably less power than its Radeon rival.
Ray Tracing Performance
RTX 4070
RX 7800 XT
Average Framerate
94.7 FPS (+11.9%)
84.6 FPS
Max Average Power
193W
252W
FPS/W
0.49 FPS/W
0.34 FPS/W
FPS/$
0.18 FPS/$
0.17 FPS/$
The 4070 delivers higher performance per watt and a better price-performance ratio in this segment, with a consistent lead over its rival. Here’s a detailed breakdown of the ray-tracing performance of the two GPUs across 11 games:
A Plague Tale: Requiem
GPU
RTX 4070
RX 7800 XT
Average Framerate
59.1 FPS
40.7 FPS
1% Lows
41.7 FPS
26.5 FPS
Crysis Remastered
Average Framerate
148.5 FPS
128.1 FPS
1% Lows
88 FPS
74.7 FPS
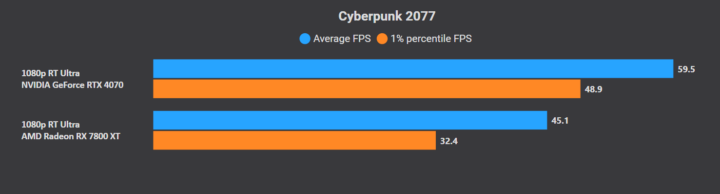
Cyberpunk 2077
Average Framerate
59.5 FPS
45.1 FPS
1% Lows
48.9 FPS
32.4 FPS
Dying Light 2
GPU
RTX 4070
RX 7800 XT
Average Framerate
87 FPS
72.9 FPS
1% Lows
73 FPS
50.2 FPS
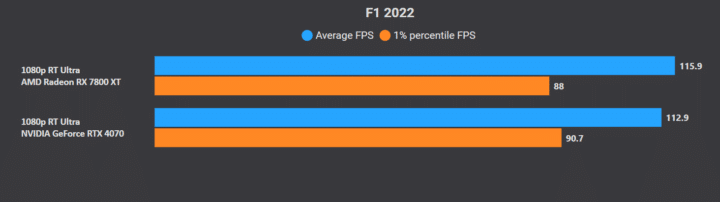
F1 2022
Average Framerate
112.9 FPS
115.9 FPS
1% Lows
90.7 FPS
88 FPS
Ghostwire: Tokyo
Average Framerate
125.2 FPS
113.4 FPS
1% Lows
73 FPS
70.4 FPS
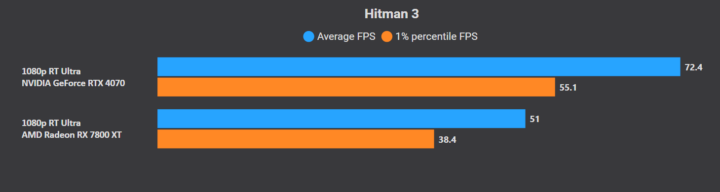
Hitman 3
GPU
NVIDIA RTX 4070
RX 7800 XT
Average Framerate
72.4 FPS
51 FPS
1% Lows
55.1 FPS
38.4 FPS
Hogwarts Legacy
Average Framerate
56.3 FPS
46.3 FPS
1% Lows
33.7 FPS
29.4 FPS
Metro Exodus
Average Framerate
71.7 FPS
67.6 FPS
1% Lows
46.6 FPS
58.6 FPS
Shadow of the Tomb Raider
GPU
NVIDIA RTX 4070
RX 7800 XT
Average Framerate
155 FPS
151 FPS
1% Lows
108.1 FPS
96.1 FPS
The Callisto Protocol
Average Framerate
94 FPS
98.3 FPS
1% Lows
60.4 FPS
56.6 FPS
Conclusion
The Radeon RX 7800 XT is faster than the RTX 4070 in rasterized gaming (1080p and 1440p) but falls behind in ray-traced titles. It may be less power efficient, but also cheaper. Following the RTX 4070 Super launch, the 4070 (non-Super) has dropped to $519, while the 7800 XT can be had for $489. Unless you’re into many ray-traced games, the Radeon RX 7800 XT is the better option: faster, more affordable, with better game bundles.


 NVIDIA GeForce RTX 4080 Super Drops Below $1000 for the First Time
 Ghost of Tsushima Averages 84 FPS on the RTX 4090 (4K) & 63 FPS on the 4060 (1080p Ultra)
 Intel Adds Support for Battlemage G21 to oneAPI: Arc B380 Launch Soon?
 NVIDIA RTX 5080 Allegedly as Fast as the RTX 4090D: Likely to Cost More than $1000