The GeForce RTX 4070 Super was the most well-received of the three Supers. It is an upgraded variant of the RTX 4070 with more cores, more cache, and a slightly higher power limit. The memory size and bus width are identical to the 4070, as are the core and memory clocks. In this post, we’ll compare the two GPUs across 33 gaming benchmarks to pick the winner.
NVIDIA GeForce RTX 4070 vs RTX 4070 Super: Specs Comparison
RTX 4070 Ti
RTX 4070
RTX 4070 Super
GPU
AD104
AD104
AD104
SMs
60
46
56
Shaders
7,680
5,888
7,168
VRAM
12GB
12GB
12GB
L2 Cache
48MB
36MB
48MB
Memory bus
192-bit
192-bit
192-bit
Memory Clock
21Gbps
21Gbps
21Gbps
GPU Boost Clock
2,610MHz
2,475MHz
2,475MHz
TBP
285W
200W
220W
MSRP
$799
$519
$599
Like the RTX 4070, the GeForce RTX 4070 Super leverages the AD104 GPU. Both are paired with 12GB of GDDR6X memory via a 192-bit bus. However, the RTX 4070 Super features 7168 cores (+22% more), up from 5888 on the RTX 4070. These are spread across 56 and 46 SMs, respectively. While the memory and bus width are the same, the RTX 4070 Super packs slightly more L2 cache at 48MB versus 36MB on the vanilla 4070.
The Super also increases the TBP (Total Board Power) to 220W, up from 200W on the 4070. Coming to the pricing, the RTX 4070 Super retails at $599 (RTX 4070’s launch MSRP), while the 4070 has dropped to $519. This establishes an almost $100 price delta between the two GPUs.
1080p remains the most popular resolution among gamers, with 59.70% of Steam users still relying on an FHD display. At 1080p, the gaming performance largely relies on the shader or core count and fixed function units (ROPs and TMUs). A small to moderate-sized cache is also beneficial as it reduces the memory latency and bus traffic.
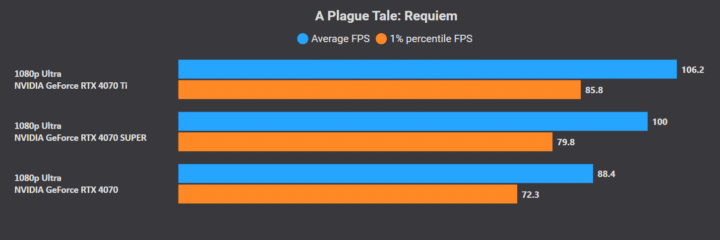
A Plague Tale: Requiem
GPU
RTX 4070
RTX 4070 Super
Average Framerate
88.4 FPS
100 FPS (13.1%)
1% Lows
72.3 FPS
79.8 FPS
Average Power
195W
218W
Assassin’s Creed Valhalla
Average Framerate
154.2 FPS
164.4 FPS (+6.6%)
1% Lows
110.1 FPS
112.2 FPS
Average Power
152W
167W
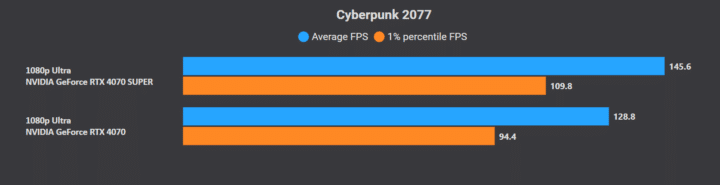
Cyberpunk 2077
Average Framerate
128.8 FPS
145.6 FPS (+13%)
1% Lows
94.4 FPS
121.8 FPS
Average Power
187W
213W
Dying Light 2
GPU
RTX 4070
RTX 4070 Super
Average Framerate
140.8 FPS
183.8 FPS (+30%)
1% Lows
121.3 FPS
125.8 FPS
Average Power
187W
207W
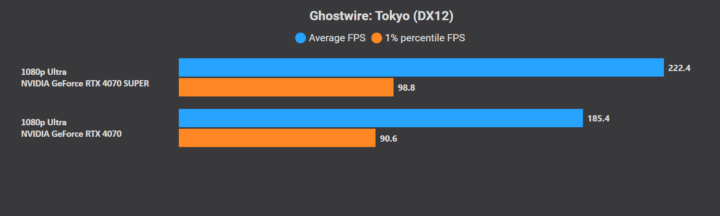
Ghostwire: Tokyo
Average Framerate
185.4 FPS
222.4 FPS (+20%)
1% Lows
90.6 FPS
98.8 FPS
Average Power
166W
185W
Hitman 3
Average Framerate
206.8 FPS
211 FPS (+2%)
1% Lows
102 FPS
106.9 FPS
Average Power
156W
169W
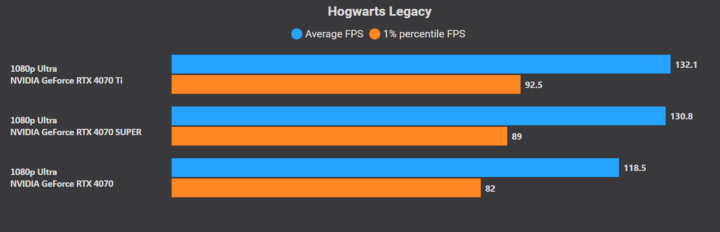
Hogwarts Legacy
GPU
RTX 4070
RTX 4070 Super
Average Framerate
118.5 FPS
130.8 FPS (+10.4%)
1% Lows
82 FPS
89 FPS
Average Power
174W
191W
Shadow of the Tomb Raider
Average Framerate
228.4 FPS
272.4 FPS (+19.3%)
1% Lows
161 FPS
190.5 FPS
Average Power
185W
203W
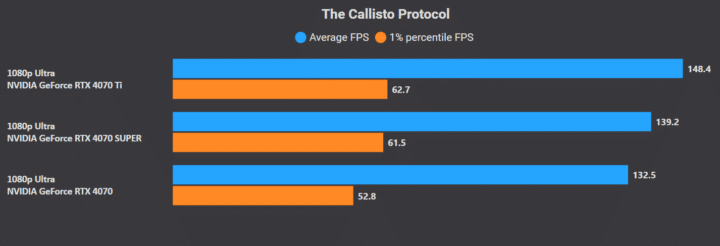
The Callisto Protocol
Average Framerate
132.5 FPS
139.2 FPS (+5.1%)
1% Lows
52.8 FPS
62.5 FPS
Average Power
155W
181W
Tiny Tina’s Wonderlands
RTX 4070
RTX 4070 Super
Average Framerate
163.1 FPS
188.4 FPS (+15.5%)
1% Lows
134 FPS
153.8 FPS
Average Power
195W
219W
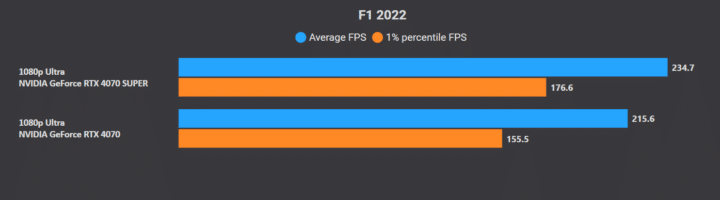
F1 2022
Average Framerate
215.6 FPS
234.7 FPS (8.9%)
1% Lows
155.5 FPS
176.6 FPS
Average Power
155W
169W
Rasterization Average, Efficiency, and Performance/Dollar
In 1080p rasterization, the GeForce RTX 4070 Super is 13% faster than the 4070 on average across eleven games. Most titles are 13% to 15% faster on the Super, although there are some outliers like Shadow of the Tomb Raider and Ghostwire Tokyo, where the delta extends to 20% and 30%, respectively. Likewise, games like “The Callisto: Protocol” and Hitman 3 perform similarly on the two GPUs.
RTX 4070
RTX 4070 Super
Average Framerate
160.2 FPS
181.1 FPS (+13%)
Max Average Power
195W
219W
FPS/W
0.82 FPS/W
0.83 FPS/W
FPS/$
0.31 FPS/$
0.30 FPS/$
The GeForce RTX 4070 has the highest average power consumption (TBP) in Tiny Tina’s Wonderlands, where it draws an average of 195W. The RTX 4070 Super maintains an average power draw of 219W, leading to a slightly higher power efficiency figure over the 4070. The value-for-money aspect of the two GPUs is almost identical with a tiny advantage for the latter.
Processors, PC gaming, and the past. I have written about computer hardware for over seven years with over 5000 published articles. I started during engineering college and haven't stopped since. On the side, I play RPGs like Baldur's Gate, Dragon Age, Mass Effect, Divinity, and Fallout. Contact: areejs12@hardwaretimes.com.