NVIDIA’s GeForce RTX 4090 is the fastest gaming GPU on the market. With over 16,384 cores spread across 128 SMs and 24GB of GDDR6X memory, it delivers potent 4K performance (usually under 400W). The RTX 4080, on the other hand, features 9,728 cores across 76 SMs with 16GB of GDDR6X memory and a TBP of 320W. The RTX 4080 Super increases the core count to 10,240 while retaining the memory and cache configuration.
| GPU | NVIDIA RTX 4080 Super FE | NVIDIA RTX 4080 FE | NVIDIA RTX 4090 FE |
|---|---|---|---|
| GPU Die | AD103 | AD103 | AD102 |
| SMs/CUs | 80 | 76 | 128 |
| Cores | 10,240 | 9,728 | 16,384 |
| RT Cores | 80 | 76 | 128 |
| Tensor Cores | 320 | 304 | 512 |
| Base clock | 2,295 MHz | 2,205 MHz | 2,235 MHz |
| Boost clock | 2,550 MHz | 2,508 MHz | 2,520 MHz |
| Memory | 16 GB GDDR6 | 16 GB GDDR6X | 24GB GDDR6X |
| TBP | 320 W | 320 W | 450 W |
| LLC | 64 MB | 64 MB | 72 MB |
| MSRP | $999 | $1,199 | $1,599 |
There’s a sizable difference between the RTX 4090 and the 4080 series specs, but the price delta is even more pronounced. The GeForce RTX 4080/RTX 4080 Super retails at $999, while the RTX 4090 starts at $1,599. That makes the latter 60% more expensive than the former.
Test Bench
- Mobo: ASUS Z790 Maximus Hero.
- Cooler: Lian Li Gld 360.
- CPU: Intel Core i9-13900K.
- Memory: 16GB x2 DDR5 6,000 MT/s CL 30.
- PSU: Corsair RM1000e.
Performance Testing Notes
- 1% lows represent a higher value than the lowest 1% of all recorded FPS. This is a good indicator of performance in taxing scenes as it gives the value where the GPU or CPU struggles the most.
- We decided to test the RTX 4080 and 4090 at 4K and 1440p (for ray tracing). The games are heavily GPU-bound in these scenarios, removing most CPU bottlenecks.


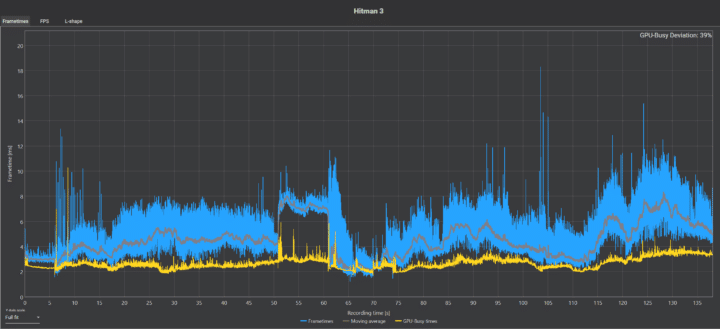
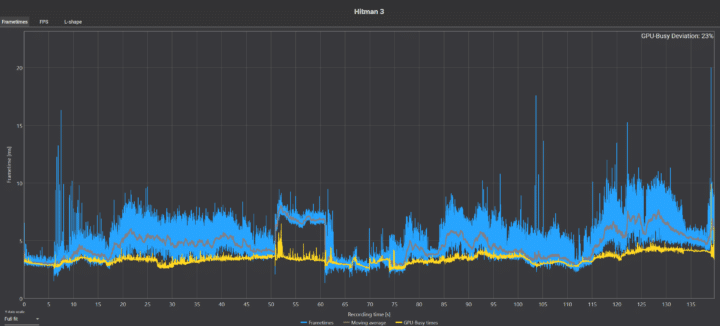
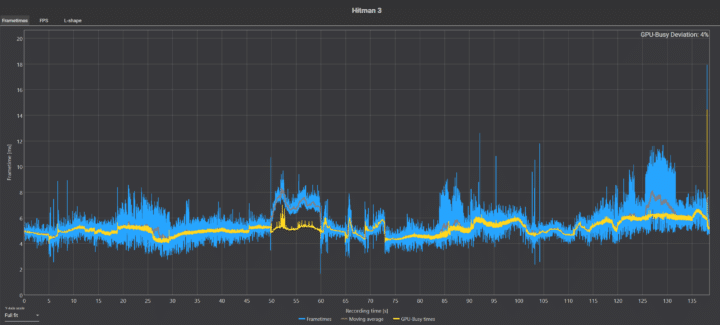
The above GPU-busy charts from Hitman 3 are a good demonstration of this. At 1080p, the GPU-Busy Deviation is 39%. This means the CPU adds 39% more time to the frametimes, leaving the GPU idle, hence bottlenecking it. At 1440p, it drops to 23% and is almost eliminated at 4K (4%). Ergo, 4K benchmarks are optimal for comparing high-end GPUs.
NVIDIA RTX 4080 vs 4080 Super vs 4090: 4K Gaming Benchmarks
4K (or 2160p) is taxing even on the most powerful graphics cards. In Asobo’s “A Plague Tale: Requiem,” the GeForce RTX 4080 falls short of the 60 FPS mark with lows of under 50 FPS. The RTX 4090 fares better, averaging 72 FPS with 61 FPS lows. The 4080 Super is a smidge faster than the 4080, averaging 1.6 FPS higher.

Alan Wake 2 is among the most technologically advanced games on PC. Even without ray tracing, the RTX 4090 manages just 59 FPS, while the 4080/4080 Super registers 46 FPS on average.

Assassin’s Creed Mirage averages 117.5 FPS on the GeForce RTX 4090, up from 96 and 97 FPS on the RTX 4080 and 4080 Super, respectively.


Frontiers of Pandora is Ubisoft’s latest technological marvel with gorgeous environments and mild ray tracing. At 4K, the RTX 4090 averages 67 FPS, versus 50.9 and 50.2 on the 4080 and 4080 Super, respectively.

Cyberpunk 2077 runs notably faster on the GeForce RTX 4090, with an average lead of 33% over the RTX 4080. The extra shaders, cache, and bandwidth all come into play in this title.

Dragon’s Dogma 2 is one of the more CPU-bound titles out there. The following benchmarks were conducted using the game’s launch version in the wilderness.

Dying Light 2 is 30% faster on the RTX 4090, with the lows exhibiting a similar delta versus the RTX 4080 4080 Super. Regardless, all three GPUs deliver nearly 100 FPS with high enough lows.


Forza Motorsport is another recent title that runs over 30% faster on the RTX 4090 than the 4080 series graphics cards.


Helldivers 2 tends to be more CPU-intensive, reducing the deficit between the 4080 Super and 4090 to just 18% at 4K.


Hogwarts Legacy was a stuttering mess at launch but following several months of updates, it runs smoothly on our testbench. It still requires 16GB or higher graphics memory at 4K, leaving a massive 43% delta between the RTX 4080 Super and 4090.


Horizon Forbidden West is 17% while Robocop Rogue City is 28% faster on the GeForce RTX 4090 than the 4080 and 4080 Super.


Shadow of the Tomb Raider is a well-optimized title, averaging 186.5 FPS on the RTX 4090 and 145.9 FPS on the RTX 4080 Super. A 29% deficit is nothing to scoff at.

The Callisto Protocol is a whopping 34% faster than the 4080 Super on the RTX 4090, averaging 88.5 FPS and 118.6 FPS, respectively. Like Ghostwire, the lows are considerably lower than they should be (just 31.8 FPS on the former).

Tiny Tina’s Wonderlands, another AMD partner title, loves the extra cores and cache on the RTX 4090. The Borderlands spinoff is 35% faster than the 4080 Super on the 4090.

Average 4K Gaming Performance
| Game | NVIDIA RTX 4080 (Avg FPS) | NVIDIA RTX 4080 Super (Avg FPS) | NVIDIA RTX 4090 (Avg FPS) |
|---|---|---|---|
| A Plague Tale Requiem | 56.4 FPS | 58 FPS | 71.6 FPS |
| Alan Wake 2 | 46 FPS | 46.3 FPS | 59.2 FPS |
| Assassin’s Creed: Mirage | 96.2 FPS | 96.9 FPS | 117.6 FPS |
| Assassin’s Creed: Valhalla | 96.5 FPS | 98.2 FPS | 114.7 FPS |
| Avatar: Frontiers of Pandora | 50.2 FPS | 50.9 FPS | 67 FPS |
| Cyberpunk 2077 | 54 FPS | 55.3 FPS | 78.5 FPS |
| Dying Light 2 | 96.1 FPS | 96.8 FPS | 125.1 FPS |
| Dragon’s Dogma 2 | 70.6 FPS | 71.2 FPS | 81.2 FPS |
| Ghostwire Tokyo | 101.9 FPS | 102 FPS | 120 FPS |
| F1 2022 | 164.8 FPS | 165 FPS | 198.8 FPS |
| Forza Motorsport | 98.3 FPS | 100.2 FPS | 133.4 FPS |
| Helldivers 2 | 84.8 FPS | 86.2 FPS | 101.5 FPS |
| Hitman 3 | 149.5 FPS | 150.6 FPS | 188 FPS |
| Hogwarts Legacy | 75.4 FPS | 80.4 FPS | 115.3 FPS |
| Horizon Forbidden West | 76.2 FPS | 78.1 FPS | 92.4 FPS |
| Robocop Rogue City | 48.5 FPS | 49 FPS | 63.1 FPS |
| Shadow of the Tomb Raider | 145.2 FPS | 145.9 FPS | 186.5 FPS |
| Skull and Bones | 77.9 FPS | 79.2 FPS | 95.2 FPS |
| The Callisto Protocol | 86.5 FPS | 88.5 FPS | 118.9 FPS |
| Tiny Tina’s Wonderlands | 96.4 FPS | 98.4 FPS | 132.5 FPS |
| 20 Game Average | 88.57 FPS (100%) | 89.86 FPS (+101.46%) | 113.03 FPS (+127.6%) |
Across our 20-game benchmark suite, the GeForce RTX 4090 is 27.6% faster than the RTX 4080, with a similar lead over the 4080 Super. The latter holds a 1.46% lead over the stock 4080 at 4K. In essence, the RTX 4080 and 4080 Super perform within the margin of error. You might see larger deficits with AIB variants of the same card.
GeForce RTX 4080 vs 4080 Super vs 4090: Ray Tracing Benchmarks
Ray tracing is more intensive on the CPU as well as the GPU. The draw calls per scene increase significantly for the former, while the latter deals with the casting, tracking, and intersection of millions of rays per frame.

In “A Plague Tale,” the GeForce RTX 4080 Super posts an average frame rate of 69.3 FPS, down from 86.3 FPS on the RTX 4090. The lows are even wider apart, with a delta of 20 FPS.

Alan Wake 2 is over 31% faster on the GeForce RTX 4090 than the 4080/4080 Super, with an average of 71 FPS. Frontiers of Pandora sees a similar deficit between the two GPUs.


Crysis Remastered uses a mix of hardware and software ray-tracing to render a tropical island with precise lighting, shadows, and reflections. In this case, the RTX 4090 is 33.6% faster than the RTX 4080 on average.

Cyberpunk 2077 features an extensive implementation of RT. Here, the RTX 4090 nets an average framerate of 78.4 FPS which is 26% higher than the RTX 4080.


F1 2022 and Forza Motorsport perform similarly, but the RTX 4090 nets a much cleaner win over the 4080/4080 Super in the former. It leads the 80-class GPUs by 33% and 20% in the two racing sims, respectively.


Ghostwire Tokyo runs poorly across all three cards with averages of around 60 FPS, but lows touching the early 30s. Hitman 3 produces a ~30% deficit between the two, in line with most of our other tests.

Hogwarts Legacy runs decently on GeForce cards, with the RTX 4090 maintaining a lead of 27% over the RTX 4080 Super. The lows maintain similar deltas between the two GPUs.


Shadow of the Tomb Raider continues its well-optimized streak, scaling effortlessly from the RTX 4080/4080 Super to the 4090. The latter is 31% faster than the former in this test, with a wider deficit in terms of lows.

The Callisto Protocol gets a nominal 9% performance uplift going from the RTX 4080 to the 4090. I suspect both GPUs are underutilized in this title, as observed in the earlier 4K benchmarks.

Average Ray Tracing Performance
| Game | NVIDIA RTX 4080 (Avg FPS) | NVIDIA RTX 4080 Super (Avg FPS) | NVIDIA RTX 4090 (Avg FPS) |
|---|---|---|---|
| A Plague Tale Requiem | 67 FPS | 69.3 FPS | 86.3 FPS |
| Alan Wake 2 | 53.7 FPS | 54.6 FPS | 71 FPS |
| Avatar: Frontiers of Pandora | 43.1 FPS | 43.8 FPS | 57.9 FPS |
| Crysis Remaster | 104.7 FPS | 106.5 FPS | 139.9 FPS |
| Cyberpunk 2077 | 62.2 FPS | 62.2 FPS | 78.4 FPS |
| Dying Light 2 | 49.9 FPS | 50.7 FPS | 65.8 FPS |
| F1 2022 | 62.2 FPS | 63.8 FPS | 83 FPS |
| Forza Motorsport | 70.9 FPS | 72.1 FPS | 85.6 FPS |
| Ghostwire Tokyo | 59.8 FPS | 62 FPS | 65.5 FPS |
| Hitman 3 | 76.1 FPS | 77.1 FPS | 99.2 FPS |
| Hogwarts Legacy | 68.6 FPS | 70.1 FPS | 72.1 FPS |
| Shadow of the Tomb Raider | 95.9 FPS | 97 FPS | 126.9 FPS |
| Metro Exodus | 88.9 FPS | 90.2 FPS | 117.7 FPS |
| The Callisto Protocol | 95.3 FPS | 96 FPS | 104.1 FPS |
| 14 Game Average | 71.31 FPS (100%) | 72.53 FPS (101.7%) | 89.53 FPS (125.6%) |
In ray-traced gaming, the GeForce RTX 4080 Super is 1.7% faster than the vanilla 4080, while the RTX 4090 holds a 25.6% lead over the 80-class graphics card. This is usually the difference between playable and optimal performance in the latest ray-traced titles (without DLSS).
Power Efficiency: Performance Per Watt
The GeForce RTX 4080 and 4080 Super draw up to 300W of power at 4K, while the 4090 goes up to 400W (50W less than its 450W TBP). In terms of power efficiency, this translates to 0.29 FPS/Watt and 0.28 FPS/Watt, respectively.

| GPU | Peak Power | Performance Per Watt at 4K |
|---|---|---|
| RTX 4080 | 298 | 0.297 FPS/Watt |
| RTX 4080 Super | 300 | 0.299 FPS/Watt |
| RTX 4090 | 400 | 0.282 FPS/Watt |
The RTX 4080 Super is the most power-efficient of the bunch, although the RTX 4090 isn’t far behind.
Performance Per Dollar and Conclusion
| GPU | Market Price (Newegg) | Performance Per Dollar at 4K |
|---|---|---|
| RTX 4080 | $1069 | 0.083 FPS/$ |
| RTX 4080 Super | $999 | 0.089 FPS/$ |
| RTX 4090 | $1699 | 0.066 FPS/$ |
The GeForce RTX 4090 may be the faster GPU, but its value-for-money aspect leaves much to be desired. While the RTX 4080 Super offers 0.089 FPS per dollar, the 4090 is good for only 0.066 FPS per dollar. The 4090 delivers 25-30% more performance for an extra $700. A costly prospect, but it’s the only one you have if you want the fastest 4K graphics card without compromise.


